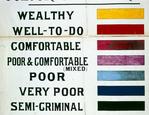
Charles Booth's Poverty Map
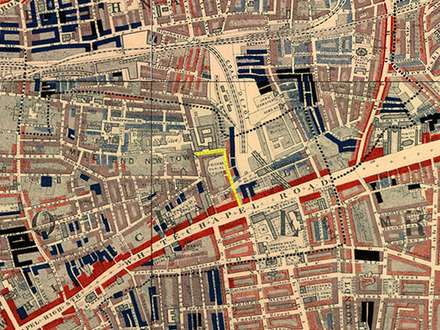
Charles Booth's 1898 Poverty Map
Resources/Mapping Methods
We decided on mapping this aspect of London because of the frequent occurrence in the texts we have read throughout the semester. Starting as far as Journal of the Plague Year and continuing in Oliver Twist, the storyline's fight against poverty remains at the forefront of the plot. To collect data we used all the texts. From Oliver Twist, we mapped Oliver's journey and plotted each location using Google Mapmaker and Google Earth. Using Journal of the Plague Year, we collected data for the frequency of deaths for each district in the London area. Many of these places did not match up with current districts or no longer existed. For this, we mapped according to region or the approximate area where the district was located.
For current data, maps were taken from London's 2009 Poverty Profile distributed by the City Parochial Foundation and the New Policy Institute.
For current data, maps were taken from London's 2009 Poverty Profile distributed by the City Parochial Foundation and the New Policy Institute.
jjjj
Poverty Throughout London Literature
Our analysis on the literature based in London describes the strong correlation between certain districts in London and the level of Poverty. Starting with Journal of the Plague Year, areas with the most deaths from the plague were districts and boroughs with high percentages of poverty and low standards of living. The plague was most destructive in theses areas because most of the citizens were too poor to be able to flee the city as the death tolls continued to rise. By mapping the areas with the highest death rates, there is a large area of deaths on London's East End, where present day districts continue to be faced with high levels of crime and high percentages of individuals living in low standards of living.
Though the Plague year is based in 17th century London, a mapping of the travels in the story Oliver Twist show the areas of high deaths in Journal of the Plague Year continue to be areas of high crime and high percentages of individuals living in poverty. The locations Oliver encountered the criminals Fagin, Sikes, and the prostitute Nancy are all located on the East End of London, the same location of the highest number of deaths. In a time span of more than 100 years, the same fate still remains for the areas of London most affected by the Plague.
Along with the data taken from the two works set in London, modern data was also used to further support our claim of continued poverty in the same areas in question. Data from Trust for London and New Policy Institute analyzed the average income, percentage of the work force that receives out-of-work benefits, and the percentage of the top deprived citizens living in specific district of London. For every aspect recorded and displayed, the same areas presented an almost identical match to the areas mapped from the two London classics.

How Does Poverty Continue?
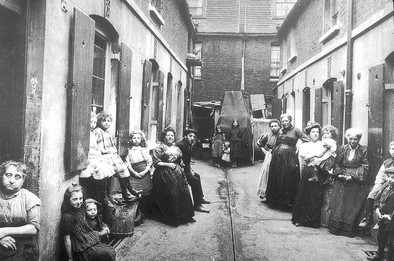
The continuing battle on poverty results from the difficultly of answering the questions on how to stop poverty and why poverty continues to thrive in the same areas. Although there is no concrete answer concerning the reason for poverty remaining in East London for over 100 years, there are some effective theories as to why no growth has occurred in the East End. The infrastructure of the area could be a contributing factor to the lack of development since at the time most of the building were built, many served a high population density and catered to fitting as many occupants as possible. These buildings were created to house most of the factory workers during the peak time of industrial labor, and with that, buildings were constructed in the most cost efficient with with a goal of fitting as many people as possible.
Because of this background, it is difficult to attract new, wealthier individuals without reconstructing the layout of the districts. Proper investments and sufficient funds are needed to redesign and rebuild an area with much needed improvements and finding an investor willing to risk funds in areas stricken with poverty is difficult. Another difficulty is the inability for deprived habitants to relocate and find new homes. Because of little to no disposable income, most individuals living below the poverty line with low incomes are unable to afford a move or reconsider their current living quarters.
Because of this background, it is difficult to attract new, wealthier individuals without reconstructing the layout of the districts. Proper investments and sufficient funds are needed to redesign and rebuild an area with much needed improvements and finding an investor willing to risk funds in areas stricken with poverty is difficult. Another difficulty is the inability for deprived habitants to relocate and find new homes. Because of little to no disposable income, most individuals living below the poverty line with low incomes are unable to afford a move or reconsider their current living quarters.
Works Cited
Adobe Illustrator. Computer software. Vers. CS5. Web.
Charles Booth Online Archive. 2002. Web. 20 Apr. 2011. <http://booth.lse.ac.uk/>.
Defoe, Daniel, and Louis A. Landa. A Journal of the Plague Year. New York: Oxford UP, 2010. Print.
Dickens, Charles, and Fred Kaplan. Oliver Twist: Authoritative Text, Backgrounds and Sources, Early Reviews, Criticism. New York: W.W. Norton, 1993. Print.
Google Mapmaker. Google Mapmaker. Google. Web. 15 Apr. 2011. <http://www.google.com/mapmaker>.
Weebly. Weebly. Web.
