Number of Deaths in Daniel Defoe's Journal of the Plague Year
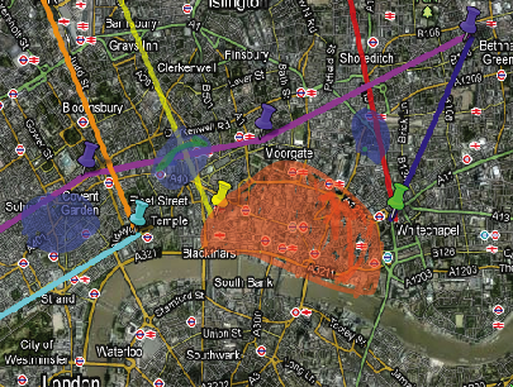
Areas in orange represent the areas with the highest number of deaths from the statistics found in Journal of the Plague Year. Blue areas represent areas with a moderate number of deaths. Exact districts could not be given a specific number since not only were deaths taken per week, but also because most districts have either changed names, boundaries, or no longer exist. With this, the data is displayed in approximate areas.
